
Part 2
Ecosystem Snapshot
Economic Impact
Total Economic Output
$2.95 Billion
generated by the music industry across the region
Value Added (GVA)
$1.65 Billion
direct contribution to the regional GDP
Employment
14,035 Jobs
supported, reflecting the sector's role as a major regional employer
Labor Income
$653 million
in earnings for workers within the music ecosystem and its supply chain
East Tennessee Music Ecosystem Total Economic Impact
Direct Employment
Multiplier effect
1 ⮕ 1.94%
For every $1 of output of the
music ecosystem, there is an additional output of $0.94 in the rest of the economy
Composition of total output ($m)
Composition of total employment
Source: County Business Patterns 2023, IMPLAN, Sound Diplomacy Research, Developed by Sound Diplomacy
The region’s music ecosystem remains below national concentration levels in both establishments and employment, indicating considerable space for growth.
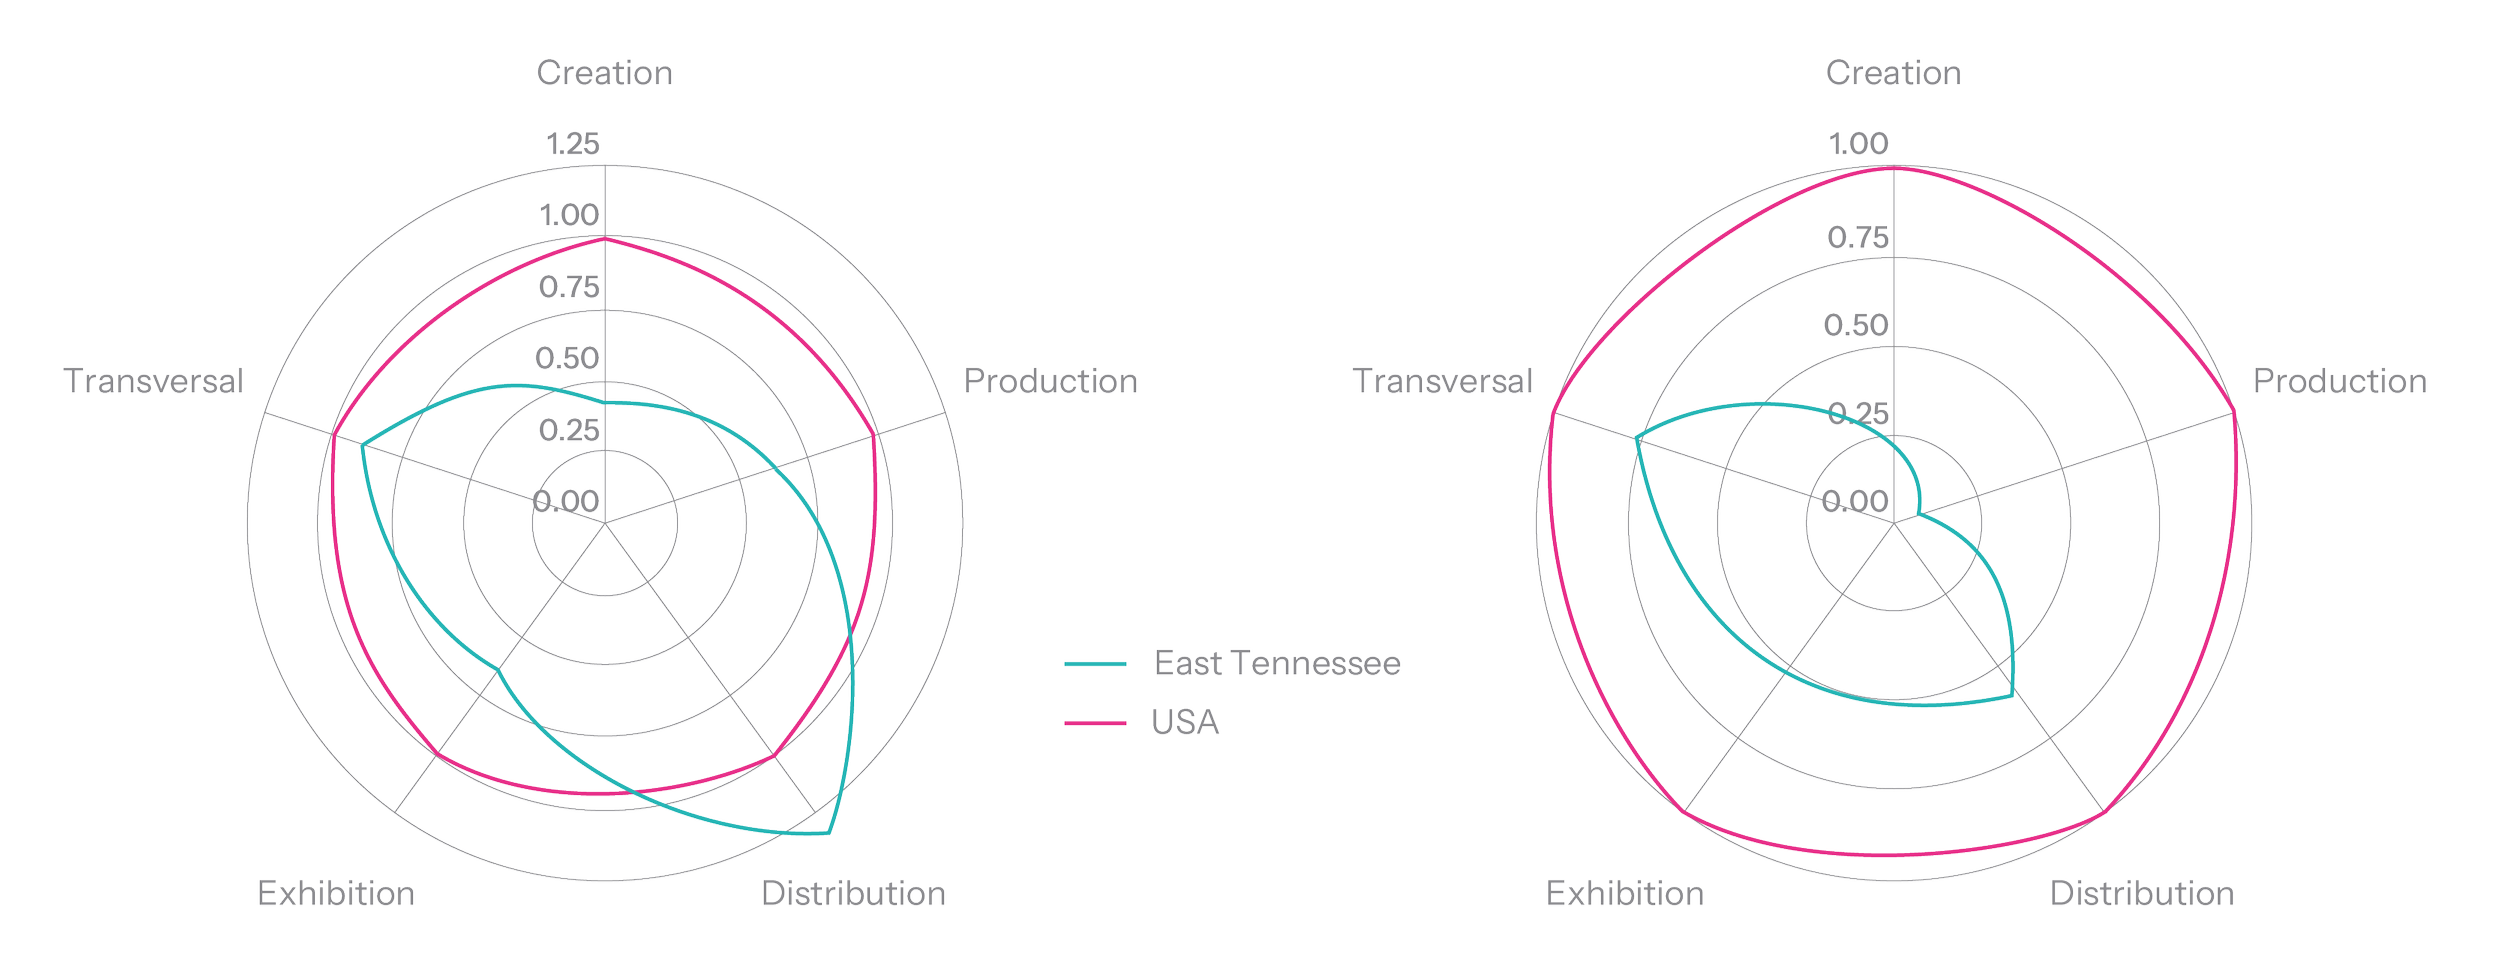
Location Quotients East Tennessee
What it is
A Location Quotient (LQ) measures how concentrated a specific music industry sector is locally compared to the US national average. How to read the graph:
Teal Line: East Tennessee data.
Pink Line: USA Baseline reference (1.00).
Outside the Pink Line: Higher concentration than the national average, indicating a regional strength.
Inside the Pink Line: Lower concentration than the national average, indicating an industry gap.
Source: Quarterly Census of Employment and Wages
Distribution is the most concentrated link. While transversal activities are near the national average, they are slightly underrepresented. Creation and production show the most significant gaps, indicating structural weakness and clear investment opportunities.
There is a need for structured government support to fill those gaps and increase the music sector’s economic impact in the region.
Asset Mapping
Geographic Concentration
Knox County serves as the primary hub, with Sevier and Blount counties acting as secondary nodes; rural areas remain underserved.
Infrastructure Gap
A critical shortage of mid-sized professional venues (400–700 capacity) hinders local artists from scaling their audiences.
Venue Landscape
The majority of live music occurs in non‑dedicated spaces (bars and restaurants), limiting the professionalization of the circuit.
Intermediary Scarcity
Support assets like management, booking agencies, and labels are nearly non-existent, forcing a heavy reliance on artist self-management.